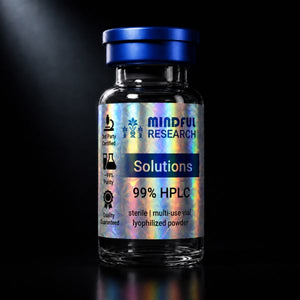



An ERR agonist such as SLU-PP-332 is measured in vitro at two levels: transcription, by ERR target-gene expression in qPCR or reporter assays, and function, by oxygen-consumption rate in a plate-based mitochondrial stress test, typically in C2C12 myotubes exposed to 1–10 µM compound for 24–48 hours against a vehicle control at matched DMSO and an ERRα inverse agonist. This guide sets out that assay design step by step, including the mitochondrial-content measurements that distinguish more mitochondria from more active mitochondria, so that a laboratory sourcing SLU-PP-332 can plan a complete experiment.
Why respiration is the right functional readout
The estrogen-related receptors, with the PGC-1 coactivators, drive the transcription of genes for oxidative phosphorylation, fatty-acid oxidation and mitochondrial biogenesis. If an agonist is doing what it should, cells should express more of those genes and, after enough time for new protein and new organelles to be made, respire more. Oxygen-consumption rate is the direct functional measure of that respiration. The general assay family is introduced in measuring mitochondrial function in vitro; this guide applies it to an ERR agonist specifically.
Cell model and exposure
C2C12 mouse myoblasts differentiated into myotubes are the standard model because skeletal muscle is where the ERR/PGC-1 axis is most studied and because the published SLU-PP-332 work used them. Differentiate for 4–6 days in low-serum medium, confirm multinucleated myotubes, then expose to SLU-PP-332 from a DMSO stock (see solubility and stock solutions) at 0.1, 1 and 10 µM with final DMSO held at 0.1 percent in every well. Transcriptional changes are measurable at 6–24 hours; respiration and mitochondrial-content changes need 24–48 hours or longer because they depend on new protein synthesis. HepG2 hepatocytes and primary myotubes are used as secondary models.
Transcriptional readouts
| Readout | Method | What it reports |
|---|---|---|
| ERR-responsive reporter | Luciferase under an ERRE promoter, co-transfected with ERRα, β or γ | Direct receptor activation; gives concentration–response curves and isoform selectivity |
| Target-gene qPCR | Ppargc1a, Cpt1b, Pdk4, Acadm, Cox and Atp5 subunits, normalised to a reference gene | Endogenous gene program in the cell model |
| Protein | Western blot for PGC-1α and OXPHOS complex subunits | Confirms that transcript changes translate to protein |
The reporter assay is where SLU-PP-332's pan-agonist profile is documented; the qPCR panel is what a laboratory runs to confirm the compound is working in its own cells before investing in respiration measurements. Methods are described in gene-expression assays in vitro.
The mitochondrial stress test
On a plate-based respirometer, live myotubes are measured for basal oxygen-consumption rate, then exposed, through the instrument's sequential ports, to oligomycin (blocks ATP synthase; the drop is ATP-linked respiration), FCCP (uncouples the membrane; the rise is maximal respiration) and rotenone plus antimycin A (blocks complexes I and III; what remains is non-mitochondrial oxygen consumption). From these four plateaus the assay yields basal, ATP-linked, maximal, spare-capacity and proton-leak values. For an ERR agonist the expected pattern after 48 hours is increased basal and maximal respiration with spare capacity preserved or increased. Normalise every well to cell number or protein, because an agonist that changes myotube size would otherwise confound the result. The broader method family is in mitochondrial metabolism in vitro: methods and readouts.
Separating content from activity
Higher oxygen consumption can mean more mitochondria or more active mitochondria, and ERR agonists are expected to do the former. Three measurements resolve it: mitochondrial DNA copy number by qPCR relative to nuclear DNA, citrate synthase enzyme activity as a matrix-volume marker, and a mitochondrial-mass dye signal by flow cytometry or imaging. Membrane-potential dyes add a per-organelle activity measure. Reporting respiration per unit of mitochondrial content tells the reader which of the two explanations holds.
Controls that make the data mean something
- Vehicle. DMSO at the identical final percentage in every arm.
- Pharmacological antagonism. An ERRα inverse agonist (XCT790 is standard) co-applied with SLU-PP-332 should reduce the response.
- Genetic dependence. siRNA knockdown of ERRα abolishing the gene induction is the published mechanistic control and the strongest evidence the effect is on-target.
- Positive control for respiration. A known inducer of mitochondrial biogenesis in the same model, run in parallel, calibrates the assay's dynamic range.
- Replicates. Biological replicates on separate differentiation runs, not only technical replicates within a plate; see controls and replicates in vitro.
A note on sourcing for this assay
Because the respiration assay is sensitive to small concentration errors, the compound's lot purity and molecular weight (290.32 g/mol) should be used in the stock calculation, and the COA kept with the plate map. Researchers searching for "SLU-PP-332 peptide buy online" are usually looking for exactly this: a research-grade material with documentation adequate for a quantitative experiment, covered in sourcing SLU-PP-332 as a research material.
Related research guides
- Is SLU-PP-332 a peptide? A small-molecule ERR agonist explained
- Measuring mitochondrial function in vitro: key assays
- Mitochondrial metabolism in vitro: methods and readouts
- SLU-PP-332 published studies: what the literature shows
- SLU-PP-332 solubility and DMSO stock solutions
- Sourcing SLU-PP-332: COA, purity and identity
Research-use note
All materials discussed are supplied for in vitro laboratory research use only, and are not for human or animal use.